

Advanced Reports is a reporting tool that lets you create in-depth reports for earnings, taxes, and sales based on your store activity.
Instead of digging through raw order data, you get a clear, visual breakdown of exactly how your store is performing over any time period you choose.
This doc walks you through enabling the feature, setting up your first report, understanding each Report Series option, and reading the results once your report is live.
Enabling Advanced Reports
Note: Advanced Reports requires an All Access Pass.
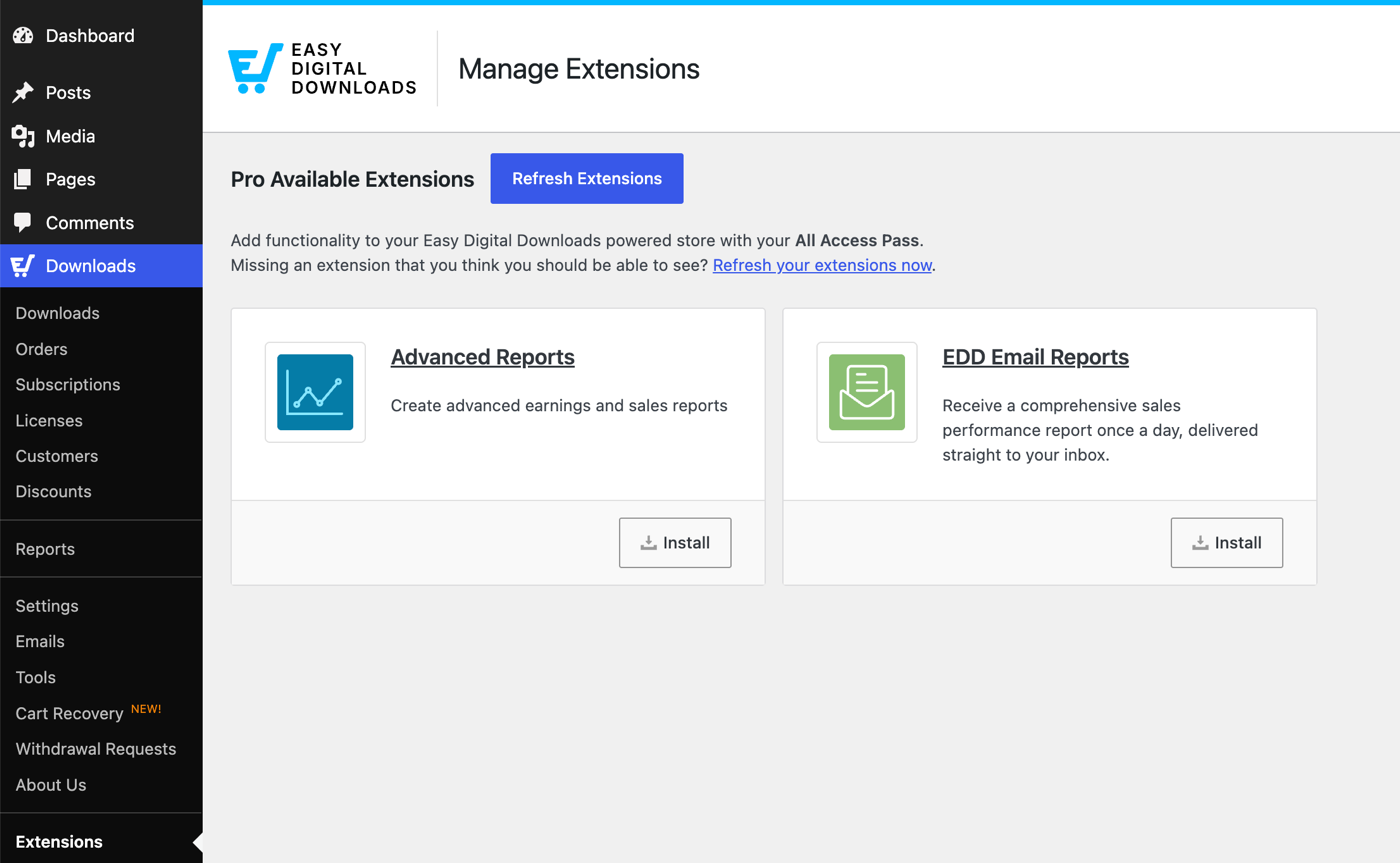
To install and activate this feature, head over to Downloads » Extensions from your WordPress dashboard. Search for Advanced Reports, then click Install.
After the feature is activated, a new Advanced Reports tab appears under Downloads » Reports.
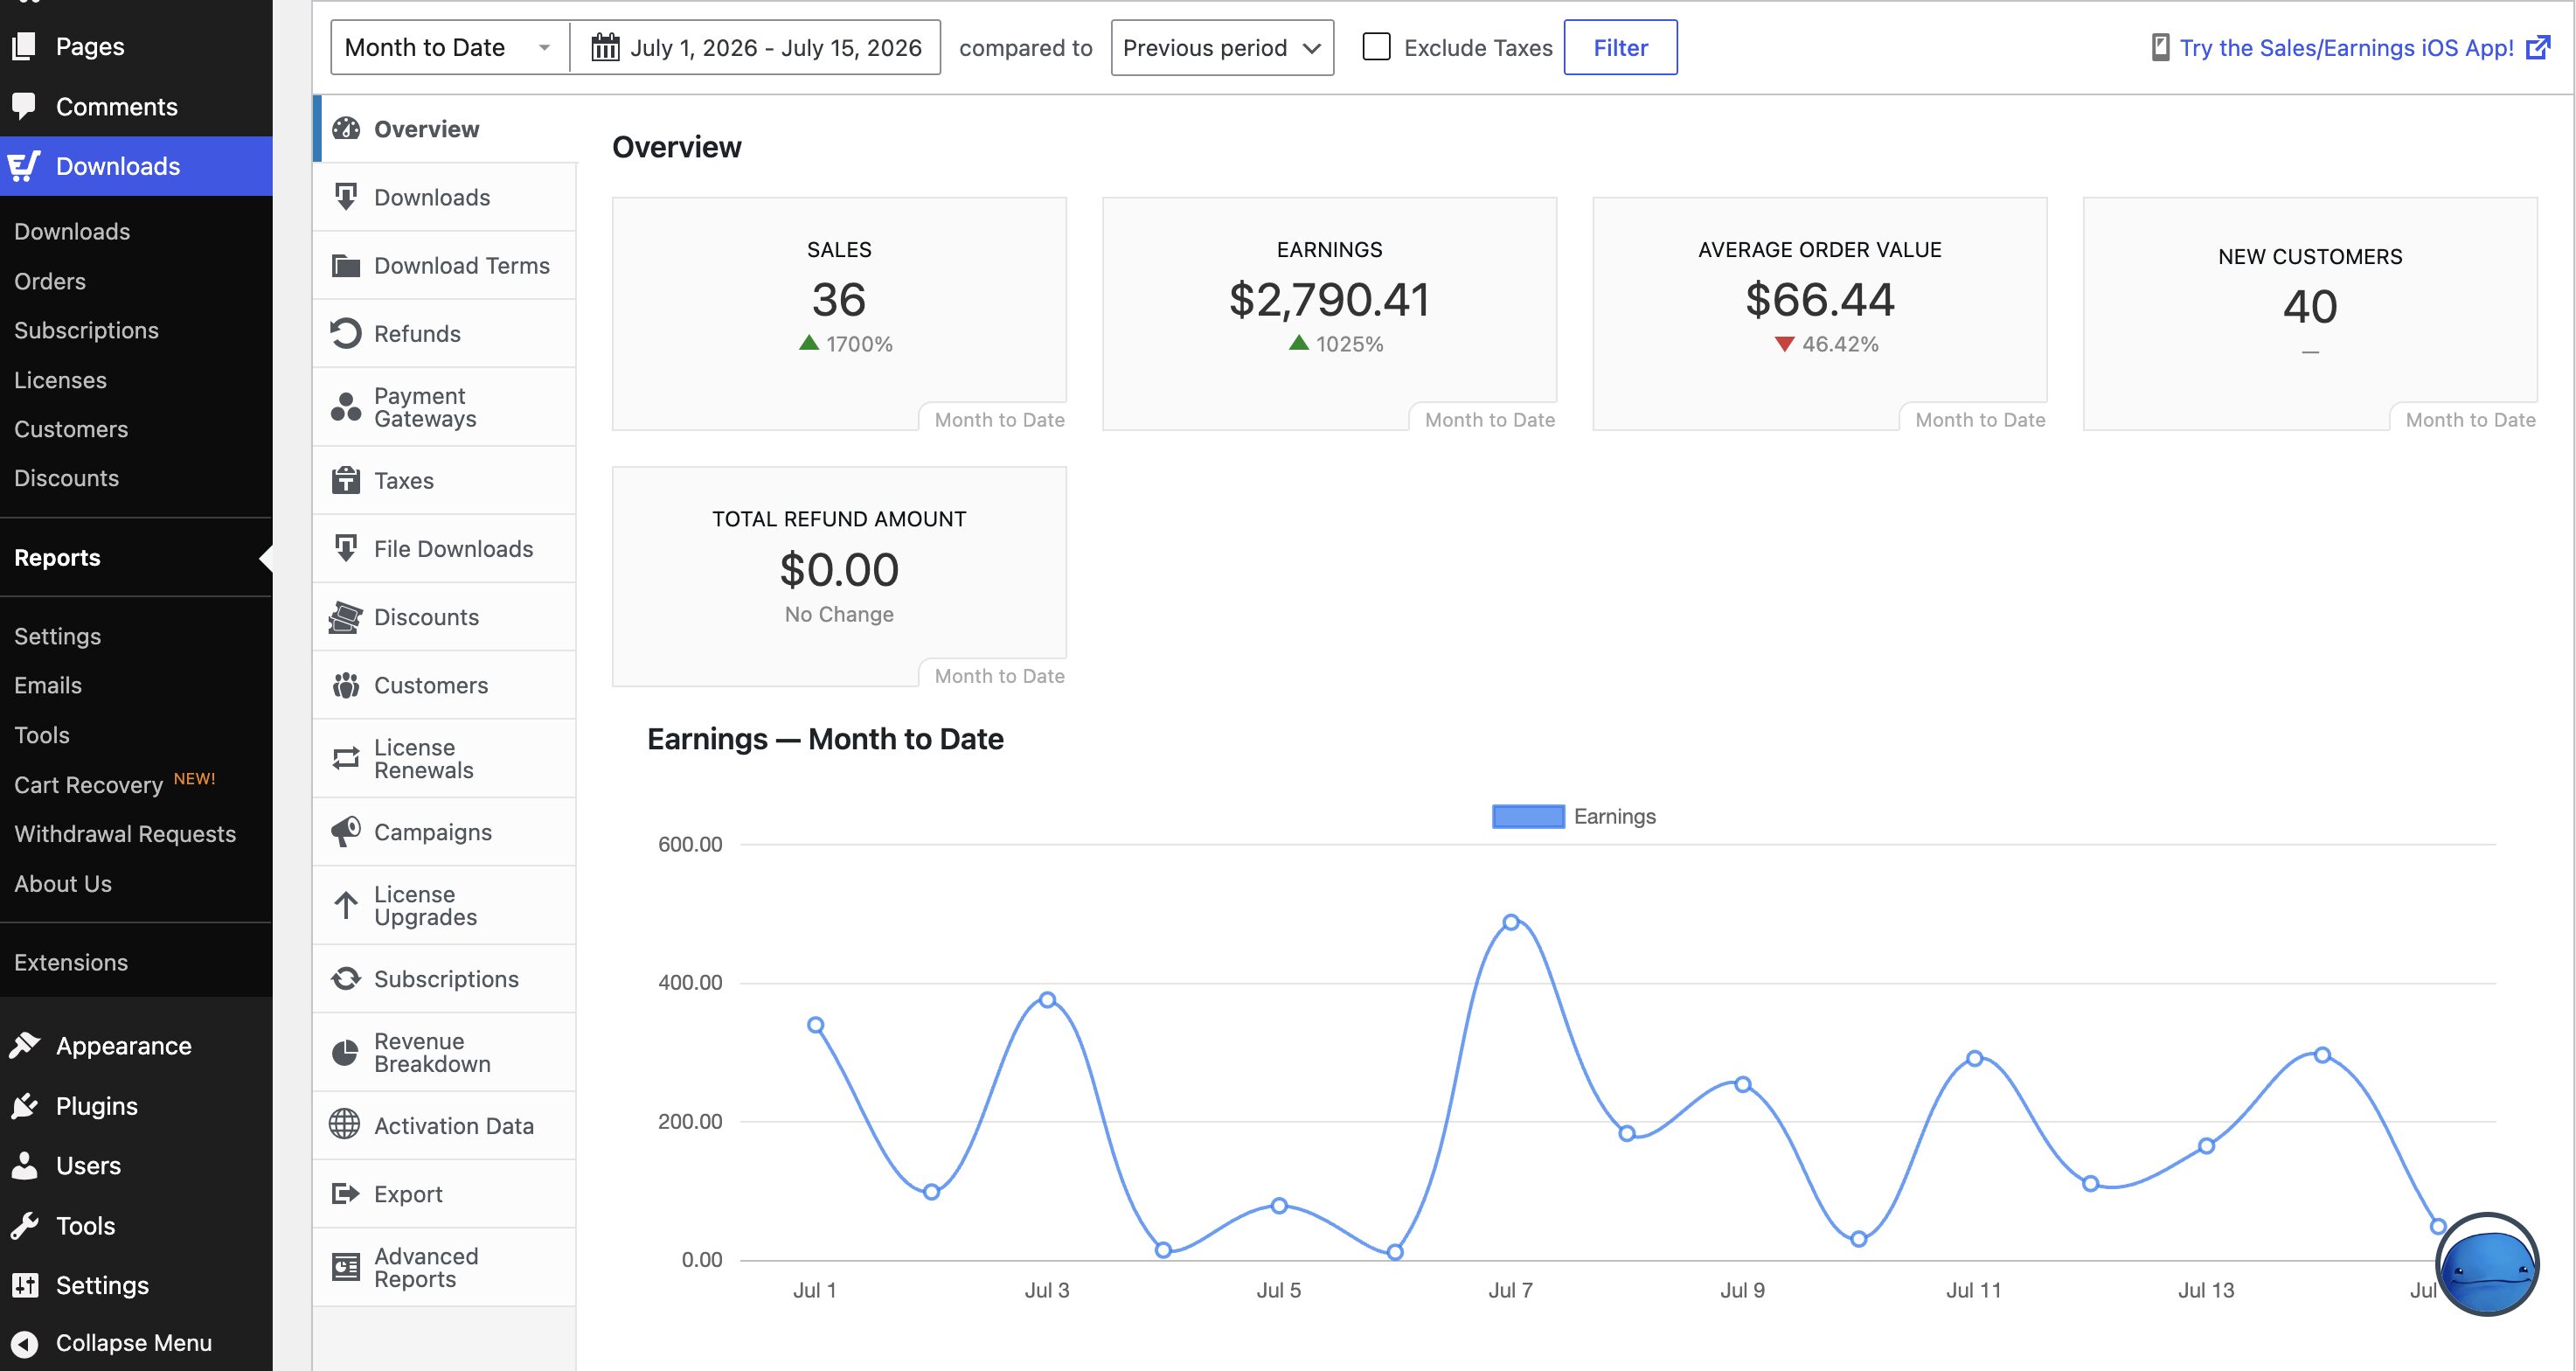
Each report you create is saved automatically and appears in your report list, so you can come back to it anytime without rebuilding it from scratch.
Creating A Custom Report
You can create any number of advanced reports just like you would do with a post or page.
Navigate to Downloads » Reports » Advanced Reports and select Create Your First Report (or Manage Reports » Add New Report for additional reports).
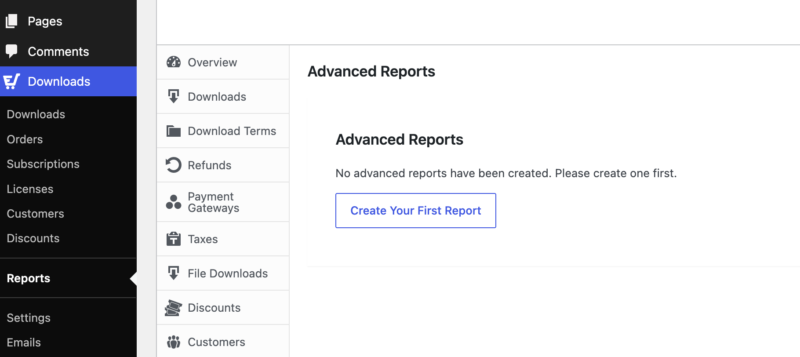
Reports contain these following fields:
- Title: Identifies the report for future reference
- Date range: Displays data going backward from the current date (e.g., last 90 days)
- Show in Dashboard: Pins reports to the WordPress Dashboard
- Report Series: Creates granular reports by selecting specific data to display
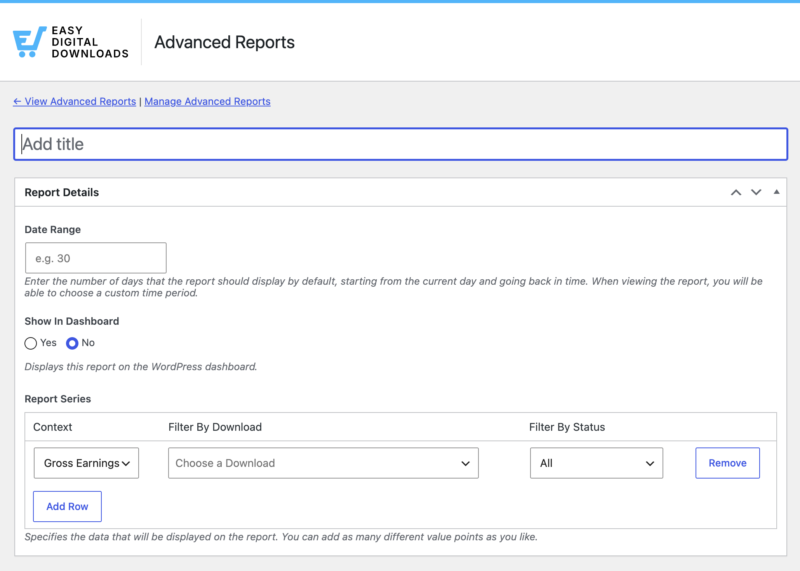
Report Series
Each report supports unlimited series, with each series representing a dataset for similar information groups.
When adding a series, select a context from these options:
- Gross earnings: Total amount earned from sales
- Net earnings: Sales revenue minus taxes
- Taxes: Amount collected for tax obligations
- Sales: Number of times an item sold
Series Filtering
Filter each series for more granular control using the available options.
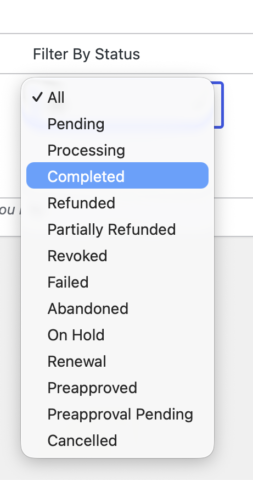
Select Filter by status to show only payments with a specific status, including:
- All
- Complete
- Processing
- Refunded
- Pending
- Abandoned
- Revoked
Use Filter by download to narrow results to specific products.
Viewing Advanced Reports
Once you’ve created your advanced reports, access them under Downloads » Reports » Advanced Reports. Use the report selector at the top right to switch between different reports.
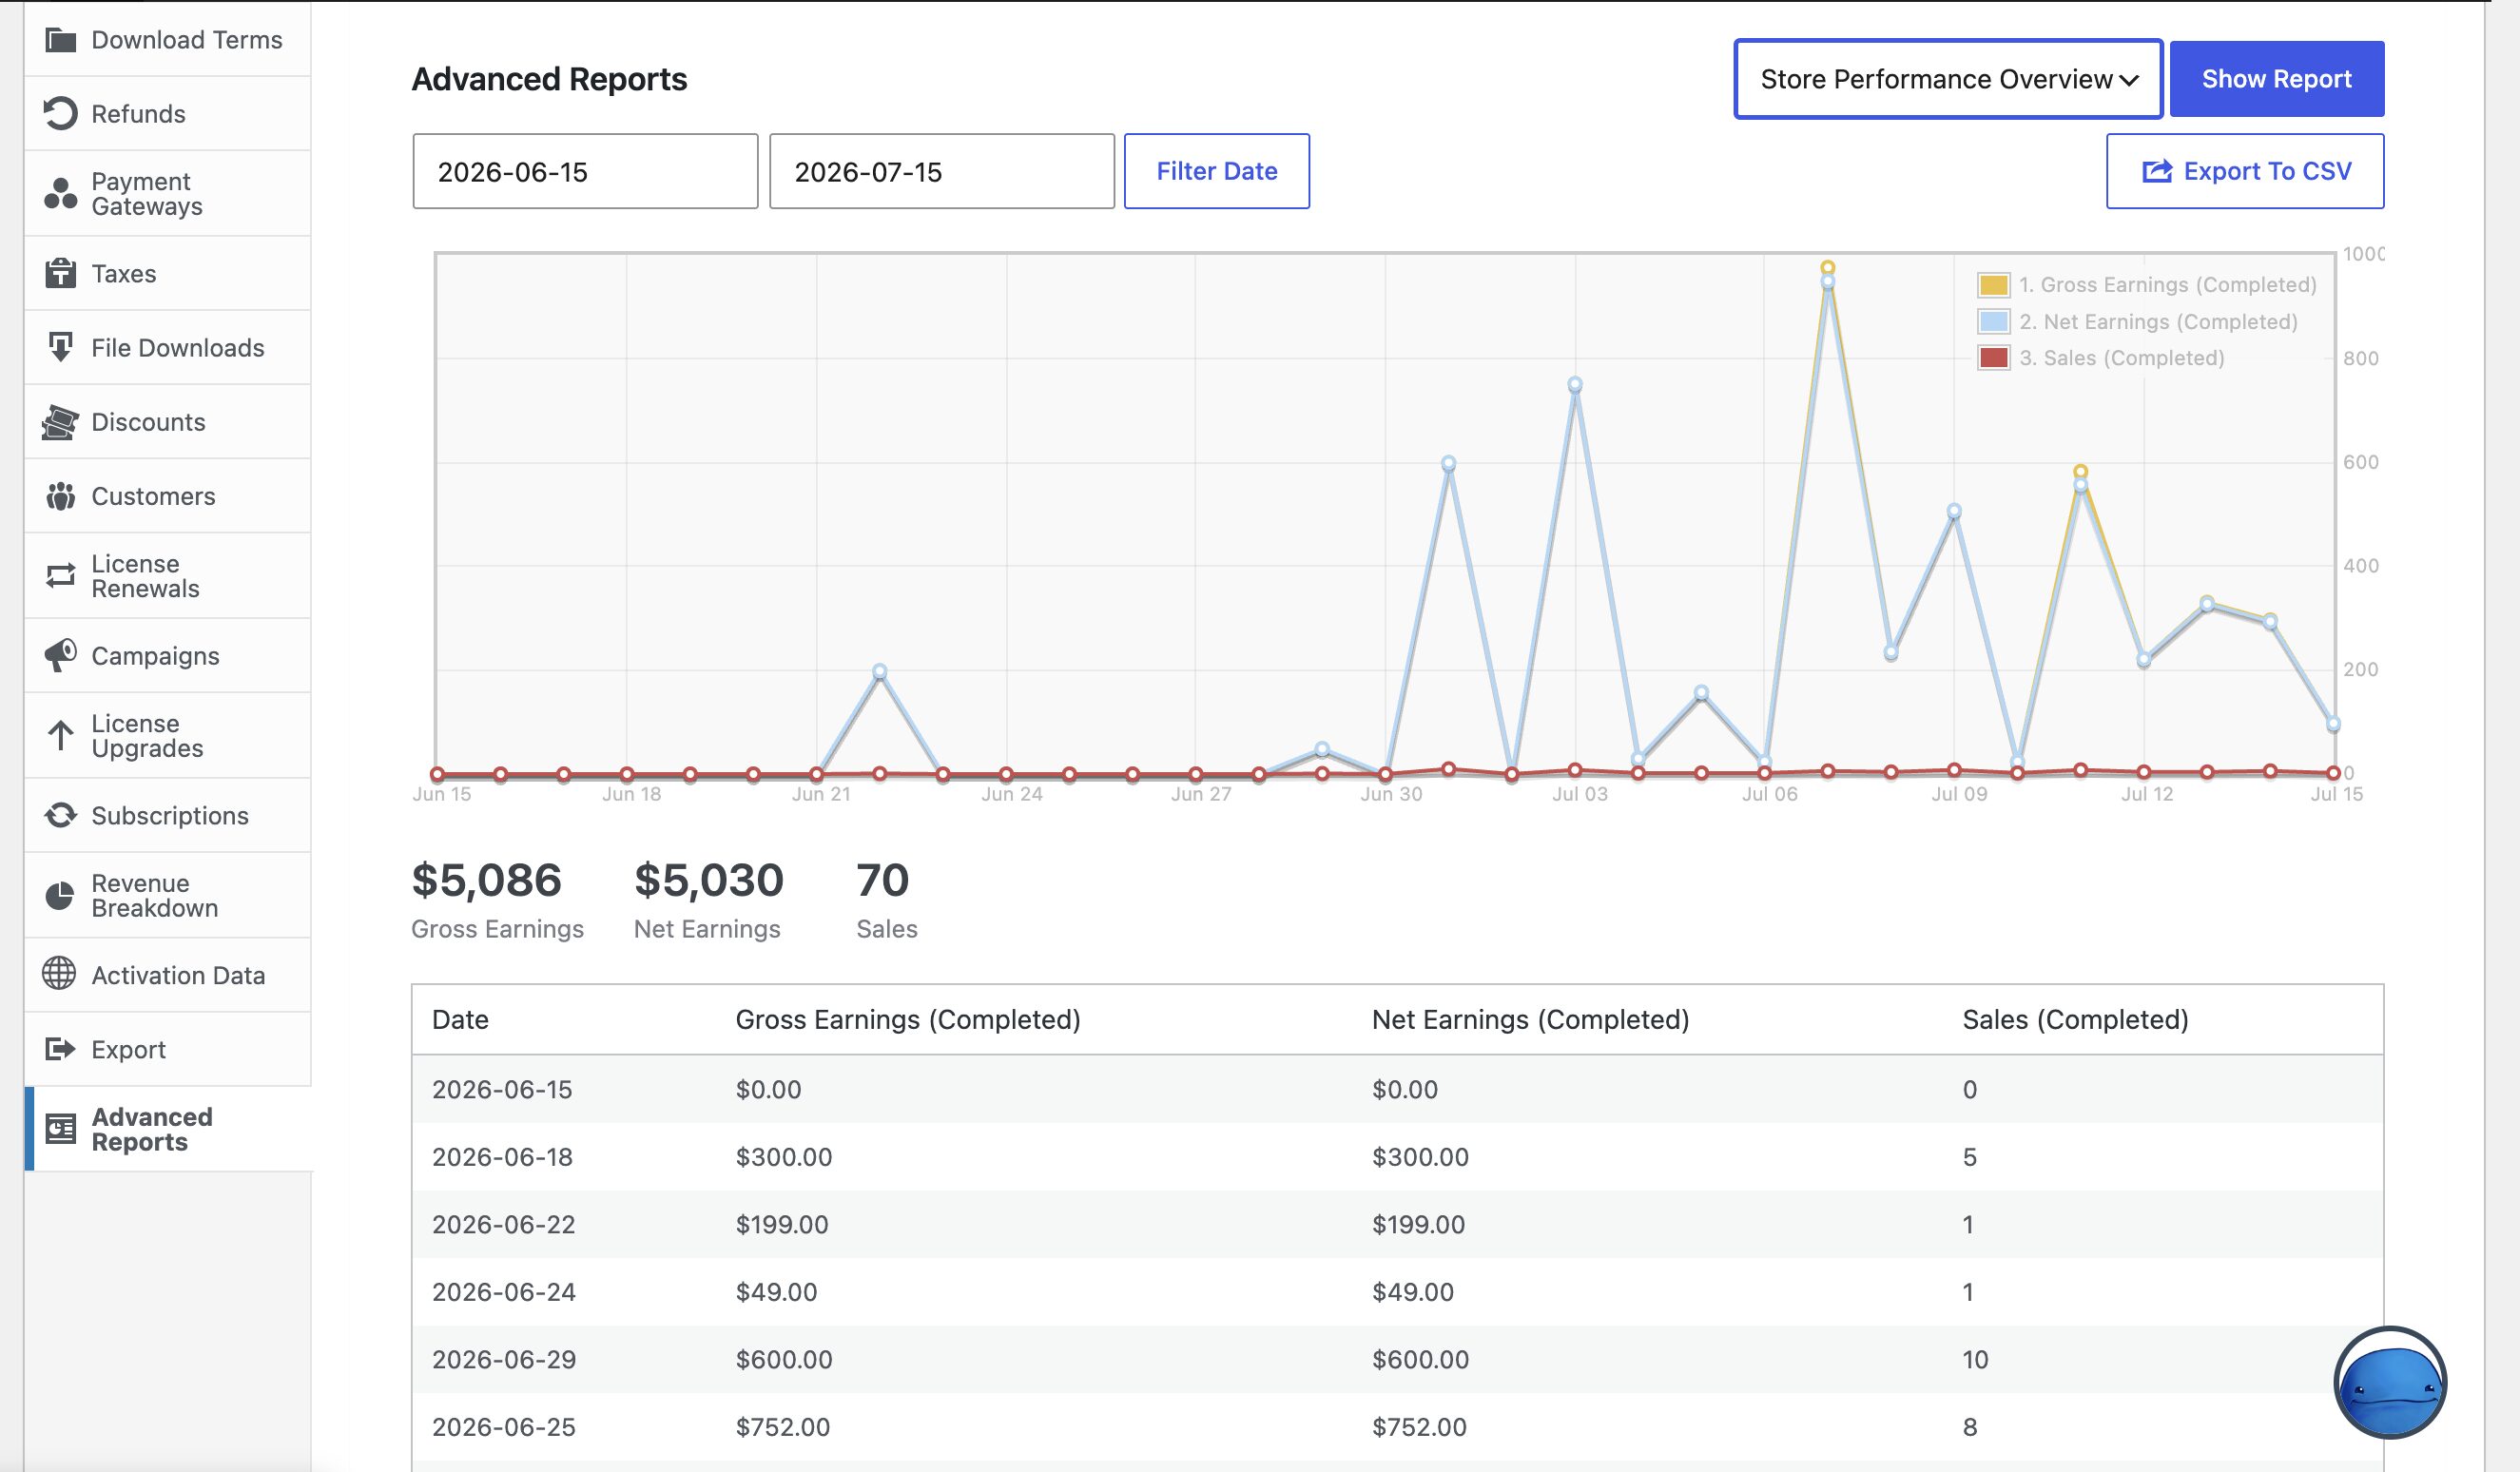
Each report shows three things:
- Line graph plotting all series over time
- Totals summary with a card for each series showing its aggregated total
- Detailed per-day data table below the graph
The initial date range displays backward from today based on the Date range field setting.
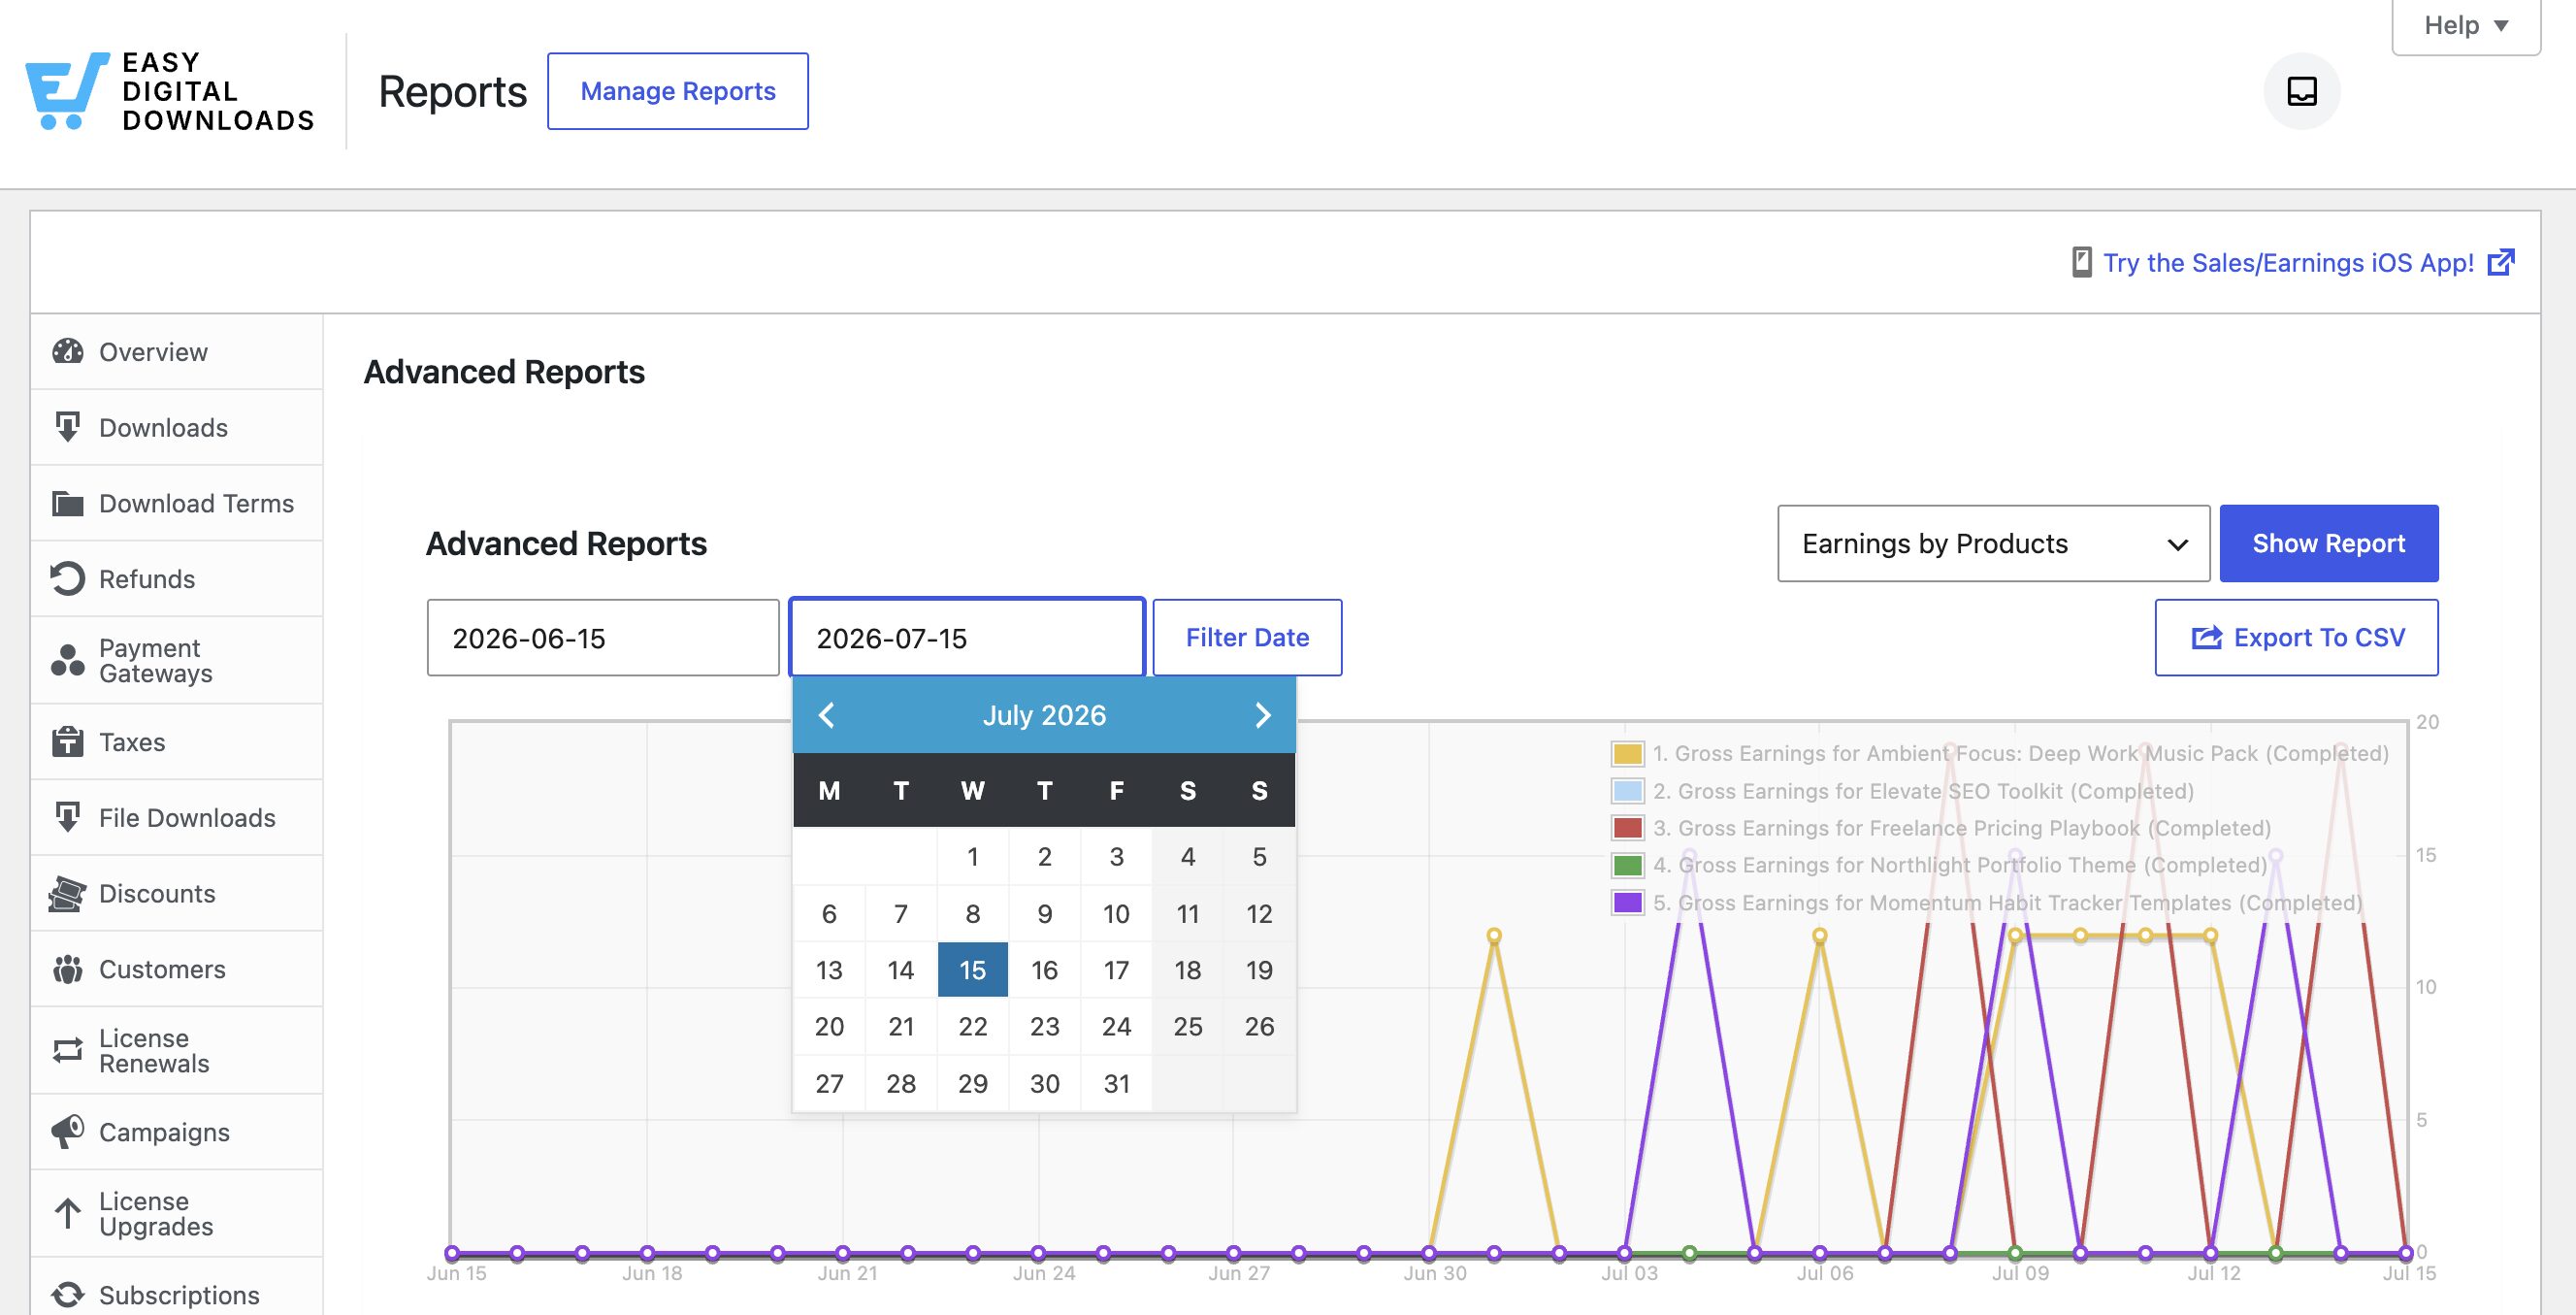
To view a different range, use the date picker above the graph to set a custom from and to date. This overrides the report’s default date range until you change it again.
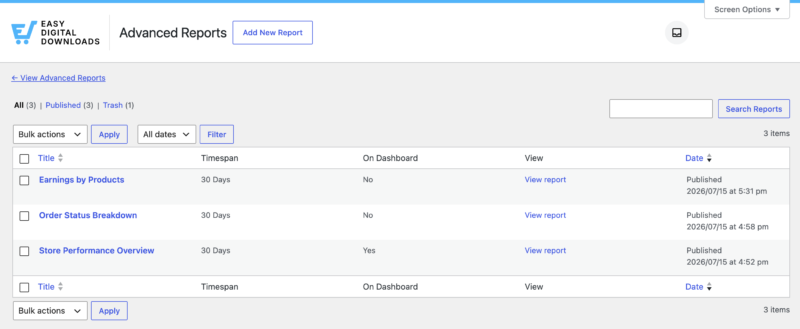
Click Manage Reports at the top to view all created Advanced Reports.
Exporting Reports
You can export any of your advanced reports by clicking on the Export to CSV button located to the right of the date filter.
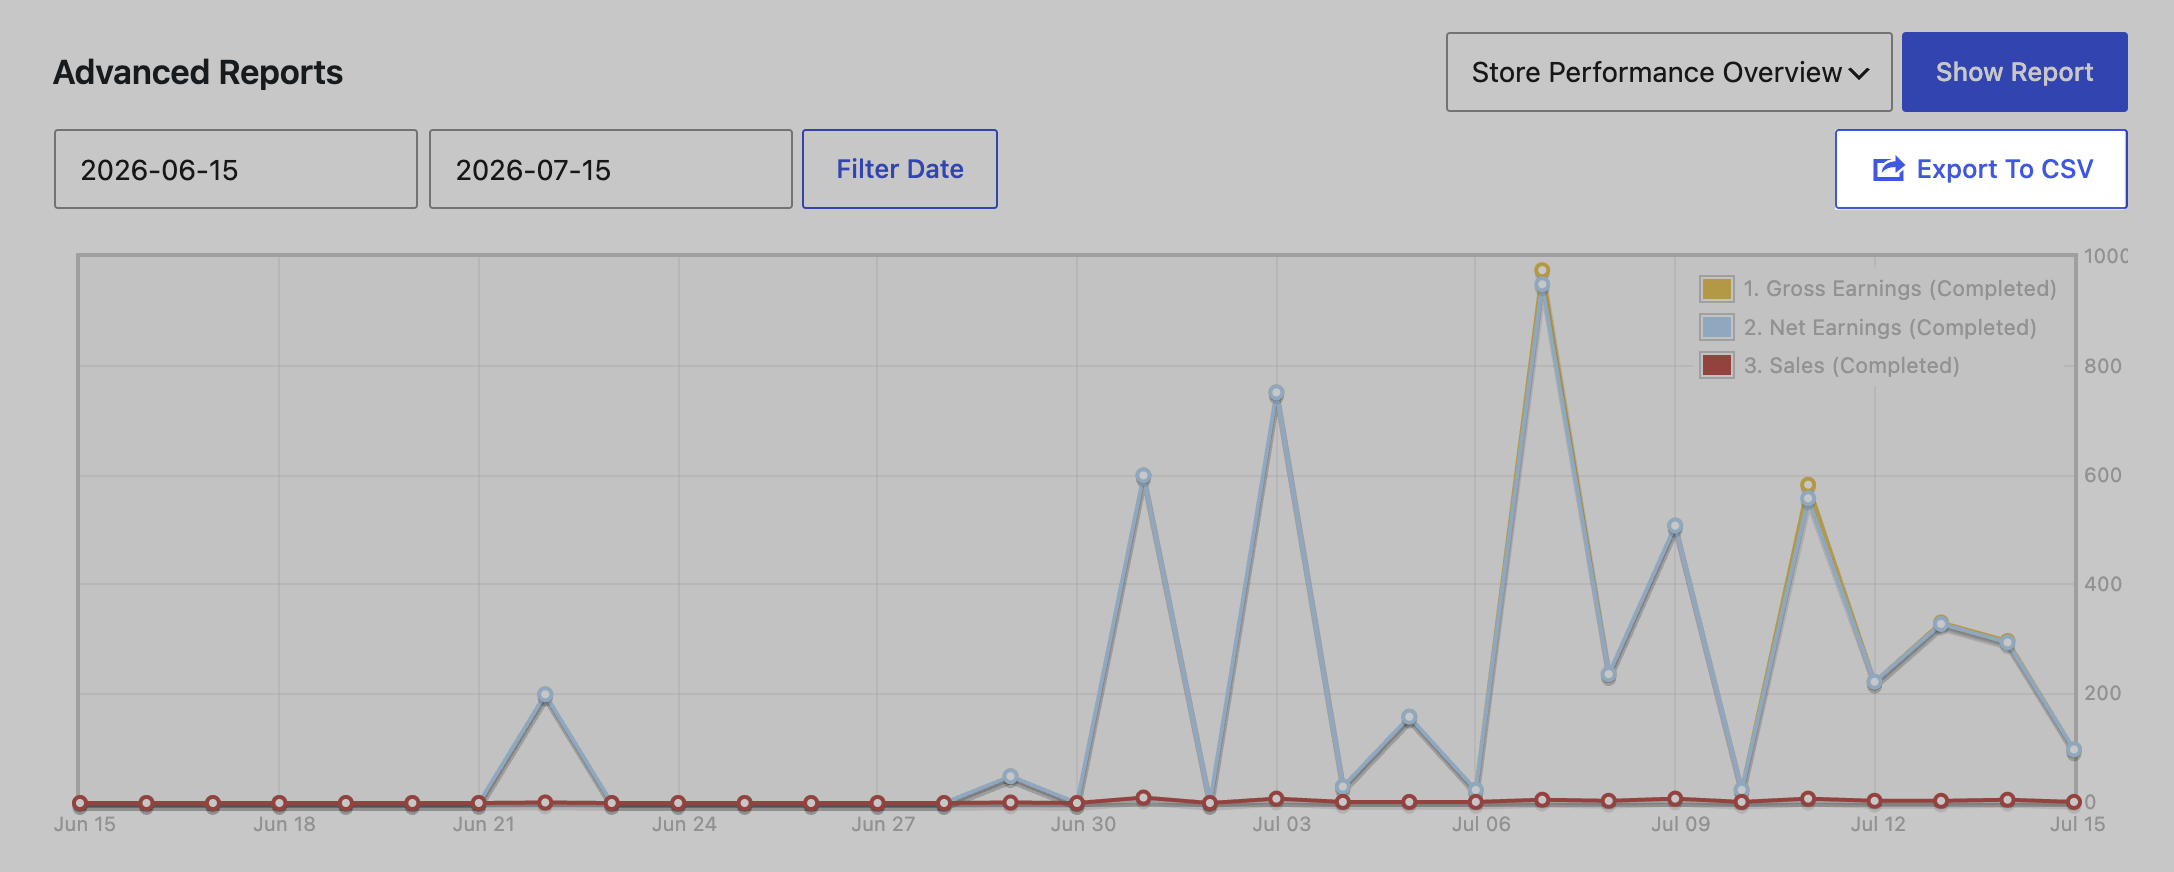
You’ll be able to download the report in a semicolon-delimited CSV file, which you can then open in Microsoft Excel to further manage your data.
Exported reports will have the same format as the table shown beneath the graph.
Pin to Dashboard
Select Show In Dashboard when creating or editing reports to add them as individual dashboard widgets. Dashboard reports display data from today backward for the specified number of days.
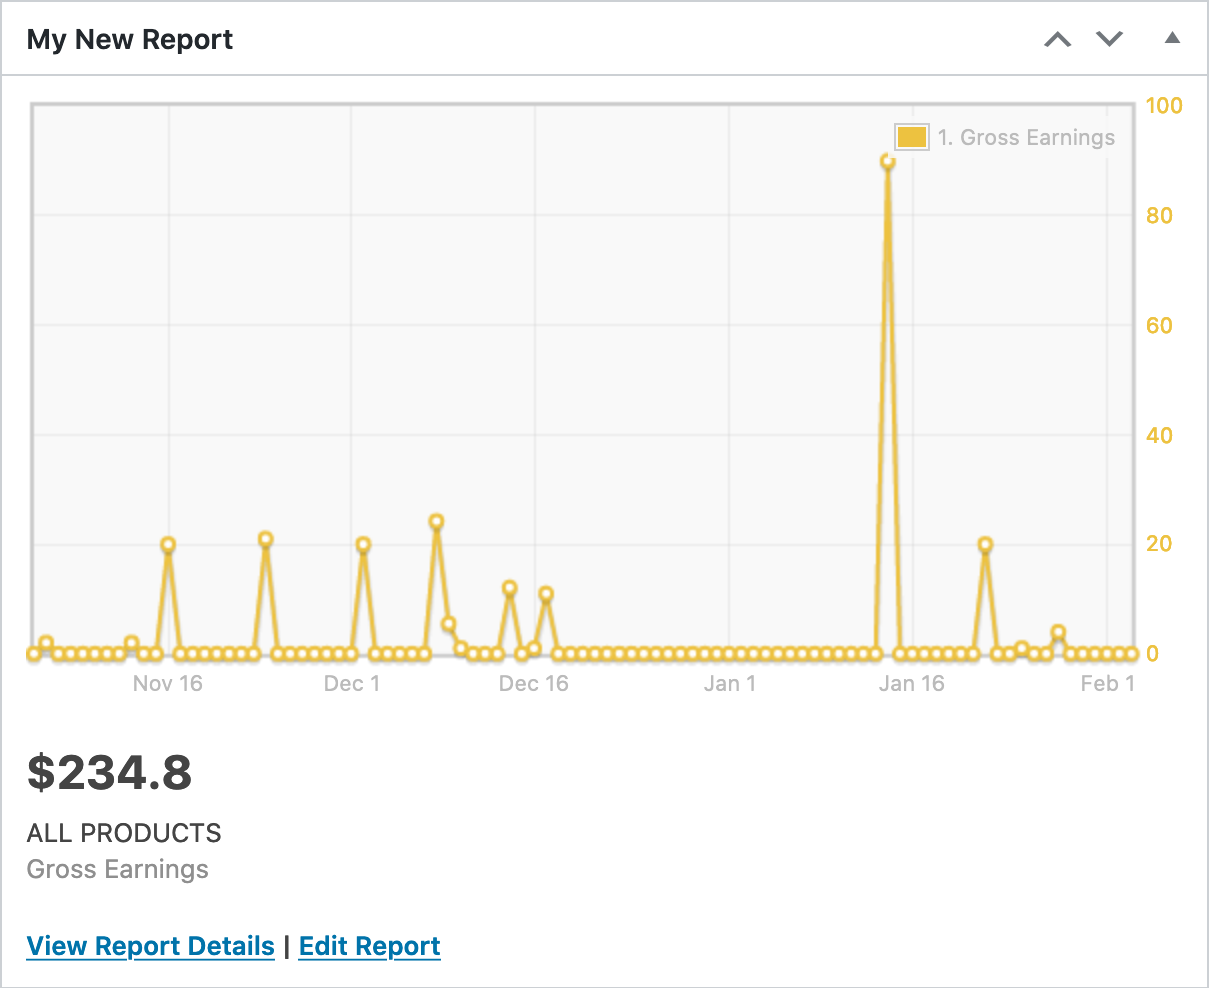
Each dashboard widget includes a graph of the report’s series, a totals summary, and two links: View Report Details to open the full report, and Edit Report to change its settings.