Are you using eCommerce reports to maximize your online selling success?
If not, you should be!
In the dynamic world of online sales, data is king. Ecommerce reporting tools provide invaluable insights. They help you make informed decisions, optimize your strategies, and drive business growth.
As a top WordPress eCommerce plugin, Easy Digital Downloads simplifies and streamlines reporting.
🔎 In this article, I’ll cover:
What Are eCommerce Reports?
In a nutshell, eCommerce reports are comprehensive data summaries that provide insights into the performance and various aspects of an online store. They are essential tools for:
- Tracking key metrics
- Analyzing trends
- Making informed decisions
- Identifying areas for improvement
- Optimizing and growing your eCommerce business
The primary purpose of these reports is to gather and present data in a structured and meaningful way. This enables you to understand your store’s performance, customer behavior, product sales, marketing effectiveness, and inventory levels.
The Importance of eCommerce Reports
Ecommerce reporting provides quantifiable data points that help you move away from guesswork. You can find ways to reduce abandoned carts, drive engagement, and boost revenue.
Effective use of reports allows online sellers to:
- Track key performance indicators (KPIs). This could include revenue, conversion rates, and customer acquisition costs.
- Identify best-selling products and popular product categories to optimize inventory and marketing efforts.
- Analyze customer behavior, preferences, and purchasing patterns to improve customer experience. reduce abandoned carts, and increase retention rates.
- Check the effectiveness of marketing campaigns and advertising channels to optimize marketing spend.
- Manage inventory levels to minimize stockouts and overstocking.
- Detect and respond to emerging trends and market shifts.
Data-driven reports help online businesses make strategic decisions based on facts. This leads to increased sales, improved operational efficiency, and enhanced customer satisfaction.
Types of eCommerce Reports
Effective reporting encompasses a wide range of data points and metrics that provide valuable insights into various aspects of an online business. Here are some of the key types of eCommerce reports.
Sales Reports
Sales reports are among the most fundamental reports for any eCommerce business.
These reports provide an overview of your store’s revenue, sales volume, and performance over a specific period. Key sales report metrics include total sales, sales by product, sales by customer, sales trends, and revenue growth rates.
By analyzing sales, you can identify your top-selling products, track sales performance against targets, and make informed decisions about product pricing, promotions, and inventory management.
Customer Reports
Customer reports offer valuable insights into your customer base. They give you a better understanding of their behavior, preferences, and lifetime value.
These reports typically include metrics such as acquisition sources, retention rates, customer lifetime value (CLTV), and demographics.
By leveraging customer reports, you can optimize your marketing strategies, improve customer retention efforts, and identify opportunities for targeted promotions or personalized offerings.
Product Performance Reports
Product performance reports provide detailed analysis of how individual products or product categories perform within your eCommerce store.
These reports typically include metrics such as best-selling products, product views, product conversion rates, and product profitability.
By analyzing product performance reports, you can identify top performers, optimize product descriptions and pricing, and make informed decisions about product assortment and inventory management.
Marketing Reports
Marketing reports offer insights into the effectiveness of your marketing campaigns and advertising efforts. These reports typically include metrics such as:
- Traffic sources
- Conversion rate
- Cost per acquisition
- Return on investment (ROI)
Analyzing these reports helps optimize your marketing budget allocation. Use them to identify the most effective channels for reaching your target audience. Then you can make data-driven decisions to improve your overall marketing strategy.
Inventory Reports
Inventory reports are crucial for eCommerce businesses that sell physical products. They provide detailed information about stock levels, inventory turnover, and carrying costs.
Monitoring inventory reports helps you ensure enough stock levels to meet customer demand. You can use them to identify slow-moving or obsolete products. They can also help optimize inventory management processes to reduce carrying costs.
EDD + WordPress eCommerce Reporting Tools
There is a wide range of platforms, tools, and services you can use to help track and monitor your business.
The best options depend on the type of business you have and the type of platform you’re using. For WordPress users selling digital products, you can’t go wrong with Easy Digital Downloads (EDD).

EDD provides built-in reports to help you gain valuable insights into your business. They’re user-friendly and accessible.
You can access and analyze essential metrics without complex third-party solutions. Plus, it integrates with Google Analytics via MonsterInsights and other WordPress plugins.
To access them, go to Downloads » Reports from your WordPress dashboard.
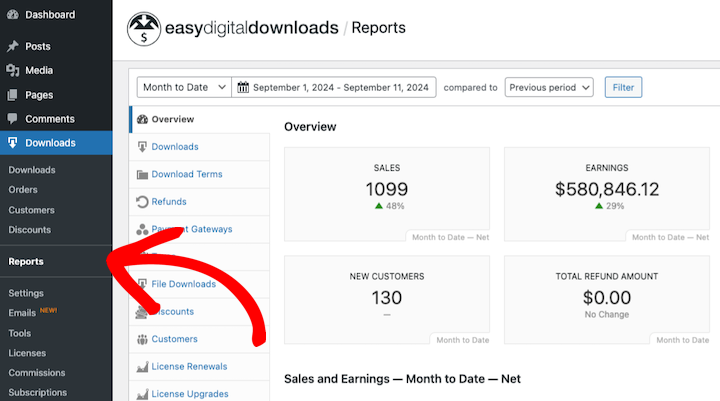
Here, you’ll find various pre-built reports and graphs for your eCommerce store.
One of the standout EDD features is its intuitive interface. With a few clicks, you can filter and customize the reports. Each report lets you view data for a certain period of time (Month to Date by default) and compare it to a past period.
Also, you can view and compare data for specific time periods and easily export your store data to CSV files.
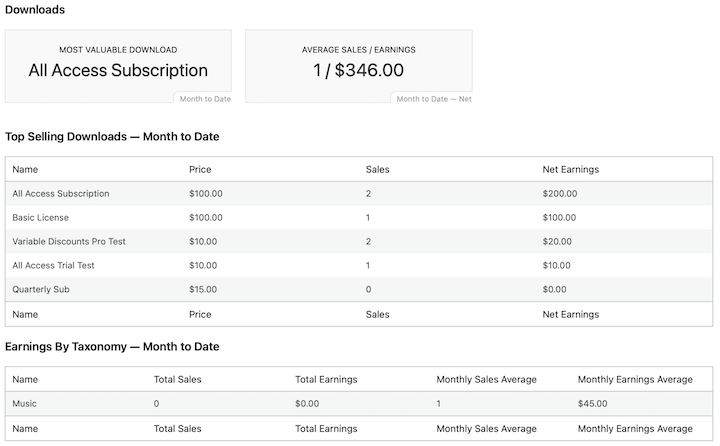
Downloads
The Downloads tab is where you find an overview report for your products. Analyze the performance of your digital products, including:
- Most valuable downloads
- Average sales and earnings
- Top selling downloads
- Earnings By Taxonomy (Tags and Categories)
This information can guide your product development and pricing strategies.
Payment Gateways Report
Track the performance of your payment gateways with this report. You can view successful transactions, complete vs pretending and failed sales, and refunds.
The data shows the gateways used during specific time frames.
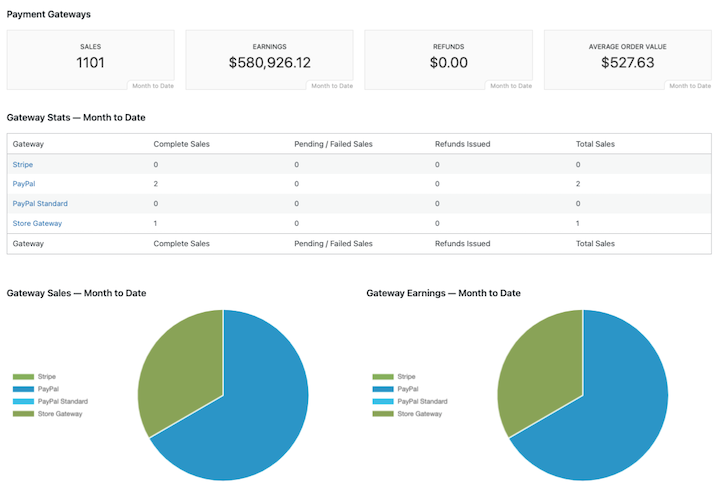
The data can also help identify ways to improve and optimize your checkout.
Customers
Gain insights into your customer base, including:
- New customers
- Average revenue per customer
- Average orders per customer
- Top 5 customers
- Most valuable customers
These reports help you identify opportunities for marketing campaigns and customer loyalty initiatives.
EDD also keeps a separate record for each customer. You can view and edit the record at any time, track CLTV and activity, link records to their user profiles, and more.
License Renewals and Upgrades
If you offer digital products such as software that requires licenses, EDD License Renewals and License Upgrade reports can help you track and monitor them. You can easily see how many renewals and upgrades you have over a given period and your earnings from each.
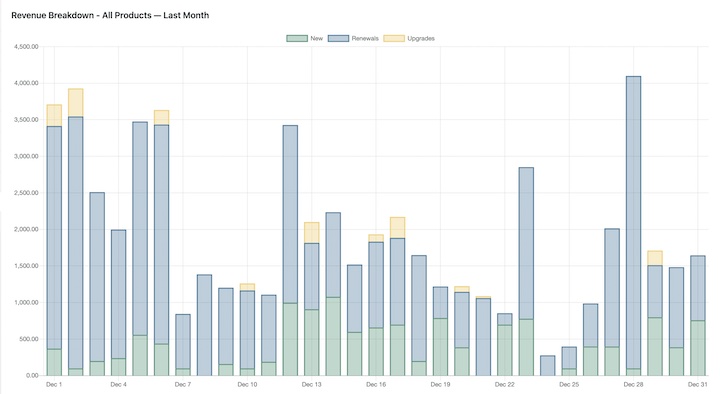
Revenue Breakdown
The Revenue Breakdown report is one of the newest reporting features added to Easy Digital Downloads. It helps you gain insights into your recurring revenue business with a detailed breakdown of new sales, renewals, and upgrades.
Subscriptions
This report offers a look into your subscription-based products and recurring revenue streams. This includes new and active subscriptions, cancellations, and renewal rates. The reports help you track key metrics. For example, you can monitor total revenue, churn rates, and customer retention.
Cross-sells and Upsells
Evaluate the performance of your cross-sells and upsell strategies, helping you optimize your product offerings and increase average order value.
Taxes
Under Taxes is a filterable report detailing the taxes your store has collected. This includes both Total Taxes Collected and Taxes collected by location.
You can filter this report by downloads, country or region, and timeframe.
File Downloads
If you’re using EDD, you likely sell digital products. The File Downloads report is where you can find data on the files customers download after making a purchase from your store.
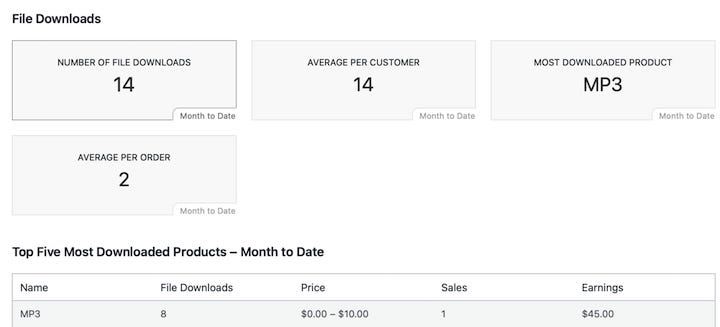
You can easily view the number of file downloads, average per customer/order, and your most downloaded content. Further down, you can see your five most downloaded products.
Discounts
One of the advantages of using EDD as your eCommerce solution is that it comes with discount code management built-in. If you decide to use them, the Discounts reports shows how your discounts are used with your store.
That includes:
- Number of discounts used
- Discount ratio
- Customer savings (total amount in discounts used)
- Average discount amount
- Most popular discount
- Top file discounts
EDD Advanced Reports
Easy Digital Downloads’ Advanced Reports extension takes your store’s reporting capabilities to the next level.
Advanced Reports is a tool for creating detailed reports on earnings, taxes, and sales based on store activity.
Filter reports by payment status, date, products, and more. Export reports to CSV files or display widgets on the WordPress dashboard for quick access to frequently needed information.
You can also create custom reports.
Under the Advanced Reports tab, you can use the report selector in the top right corner of the screen to switch between the reports.
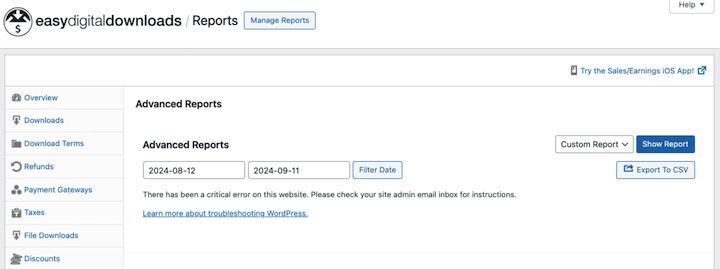
Clicking on the Manage Reports button displays all Advanced Reports you’ve created.
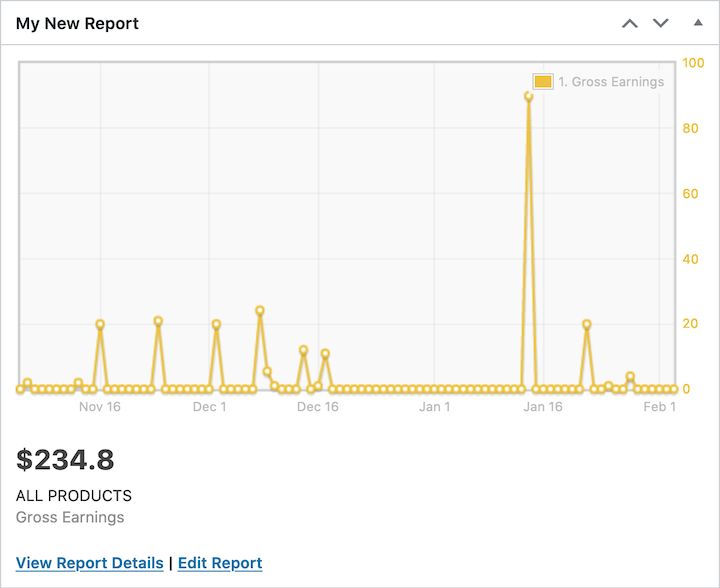
The report also presents the total amount for each series created, either as a currency or flat number.
When you view a report, you’ll see a graph summarizing the series and their associated values. There’s also a table offering more details for each value.
🔎 For more detailed guidance on using EDD reports, check out our reports documentation.
Best Practices for eCommerce Reporting
Implementing reports is just the first step in leveraging data for your online store’s success. To truly harness the power of these reports, it’s crucial to follow best practices for setting up, customizing, and regularly reviewing the data.
Setting Up and Customizing Reports
One size rarely fits all when it comes to reporting and eCommerce. Take the time to customize your reports to align with your specific business goals and key performance indicators (KPIs).
Determine which metrics are most relevant to your operations. For instance, this could include total revenue, conversion rates, and customer acquisition costs.
Additionally, consider segmenting your reports. You can categorize them based on product categories, customer demographics, or marketing channels. This detailed approach provides deeper insights and enables more targeted optimization strategies.
As I mentioned, you can create custom reports with the EDD Advanced Reports extension.
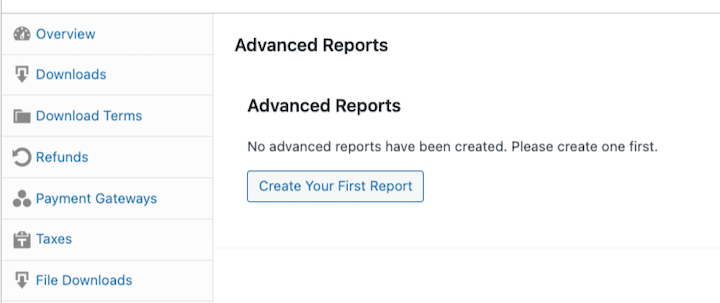
Under Downloads » Reports » Advanced Reports, click on Create Your First Report (or Add Report).
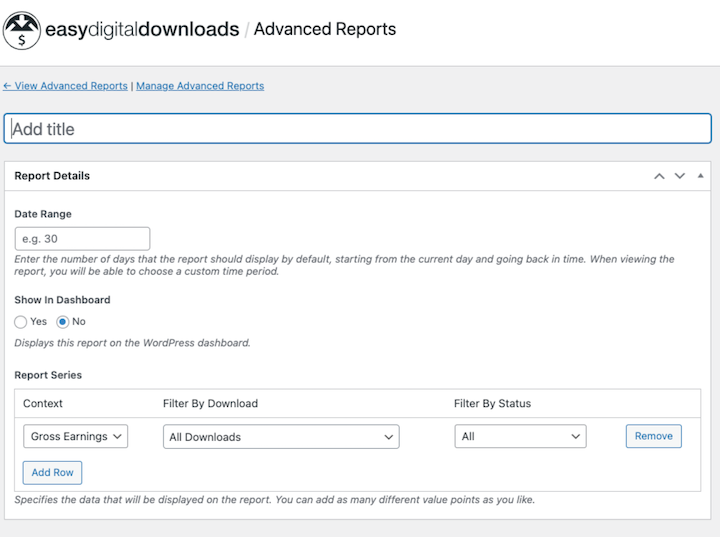
You can add a title, date range, and whether to show it in your dashboard. You also have the option to create a report series. The latter is an excellent way to create more granular reports based on specific data.
I also recommend pairing your EDD reports with other relevant eCommerce analytics reports. For instance, MonsterInsights lets you integrate your WordPress site with Google Analytics. Combining Google Analytics and other tracking tools can provide a more comprehensive view of your store performance.
Regular Review and Analysis
Effective reporting is an ongoing process — not a one-time task. Establish a consistent schedule for reviewing reports, whether it’s weekly, monthly, or quarterly. During these reviews, analyze the data and look for trends or opportunities for improvement.
Don’t just glance at the numbers; dig deeper to understand the “why” behind the data.
For instance, if you notice a spike in sales for a product, consider the potential causes. For example, could the increase be due to a successful eCommerce marketing campaign, seasonal demand, or a viral social media post?
Using Insights for Data-Driven Decisions
The true value of reports lies in the insights they provide and the actions you take based on those insights. Use the data to inform and guide your decision-making processes, from product development and pricing to eCommerce marketing campaigns.
Let’s say your reports reveal that a significant portion of your customer base is abandoning their carts during checkout. In that case, you may want to improve the checkout flow or offer other payment options to reduce friction.
Remember, data-driven decisions are not only more informed. They’re also more likely to yield measurable results and impact your bottom line.
These best practices equip you to unlock the full potential of reports, gain a competitive edge, and drive sustainable growth.
FAQs About eCommerce Reports
Let’s wrap up with some frequently asked questions.
What are key metrics to focus on when analyzing eCommerce reports?
Some key metrics and KPIs to track include:
- Sales: Total sales, sales by product, sales by customer, and sales by time period.
- Customer acquisition and retention: Customer acquisition rate, lifetime value, and customer churn rate.
- Product performance: Best-selling products, product trends, and underperforming items.
- Marketing ROI: Return on investment for your marketing campaigns.
How can I ensure that eCommerce reports are accurate and reliable?
To ensure accuracy, double-check your data sources and make sure your tools are configured correctly. Regularly update your data and keep your tools up-to-date. I also suggest using a combination of tools. For instance, in addition to your EDD reports, you can use MonsterInsights to track Google Analytics directly from your dashboard.
Can I export reports to a spreadsheet or other format?
Yes, many eCommerce platforms allow you to export your reports to CSV, PDF, or other formats for further analysis or sharing. With Easy Digital Downloads, you can export report data as CSV files.
Gain Insights With EDD eCommerce Reports
By leveraging the robust reporting offered by Easy Digital Downloads, you can gain invaluable insights into your store’s performance, customer behavior, and product trends. These essential eCommerce insights empower you to make data-driven decisions that can drive sales, optimize marketing efforts, and enhance the overall customer experience.
Don’t have Easy Digital Downloads yet? Get a premium license and start enhancing your online business in no time!
What’s next? Explore some of the best ways to increase eCommerce conversions!
📣 P.S. Be sure to subscribe to our newsletter and follow us on Facebook or Twitter for more WordPress resources!


