We’ve talked about the top website and eCommerce metrics for digital products, but comparing the performance of each product in your catalog is also important!
When it comes to running a digital product store, metrics provide crucial bits of data that inform all of your most important decisions, from what kind of new products to make, to where to allocate your time and resources. Without knowing how well your products are doing, how can you maximize your revenue or effectively market your products?
In this week’s edition of The EDDit, we talk about how to calculate and compare the performance of your digital products, so you can better identify what to prioritize.
The product page
Conversion rate
Calculating how well your products are converting is one of the most fundamental metrics – after all, isn’t the whole point of starting a digital product store to actually sell digital products?
Conversion rate can refer to any action you want your site visitors to take (even something as simple as taking part in a survey or signing up for a newsletter), and you can calculate conversion rates in a variety of contexts, such as conversion rate per X page visitors, per month, or per X new users, for example.
Often, store owners will want to know what percentage of product page visitors are converting to customers. In this case, you’d calculate your product conversion rate by dividing your total product sales by the total number of product page visitors for a specific time frame. Then, multiply by 100 to get the percentage.
Product conversion rate % = ( product sales / product page visitors ) x 100
So, if you want to find out your product conversion rate for the month of June, during which time you had 30 product sales and 450 product page visitors, you’d divide 30 by 450 – equalling 0.067 – and multiply that by 100 to get 6.7%.
Understanding this metric can help you identify if you need to make improvements on a product page, from product demos and descriptions, to product pricing. You might even find that a specific product is not converting, yet taking up a lot of your marketing budget. Or, that certain products convert particularly well, inspiring you to create new similar products that are more likely to sell.
Load time
Did you know that as little as a few seconds of page load time can put off potential customers? It follows that if your page load time is lagging, you could be losing out on significant revenue!
The truth is that consumers simply have a lot of options these days, so if your site is slow, they may not be willing to wait around. To find out how fast your pages are loading, you can use tools like Pingdom, PageSpeed Insights, and YSlow. For more information on improving site performance, check out the post we wrote about it over here.
As a general rule, a load time of less than 3 seconds is ideal.
Bounce rate
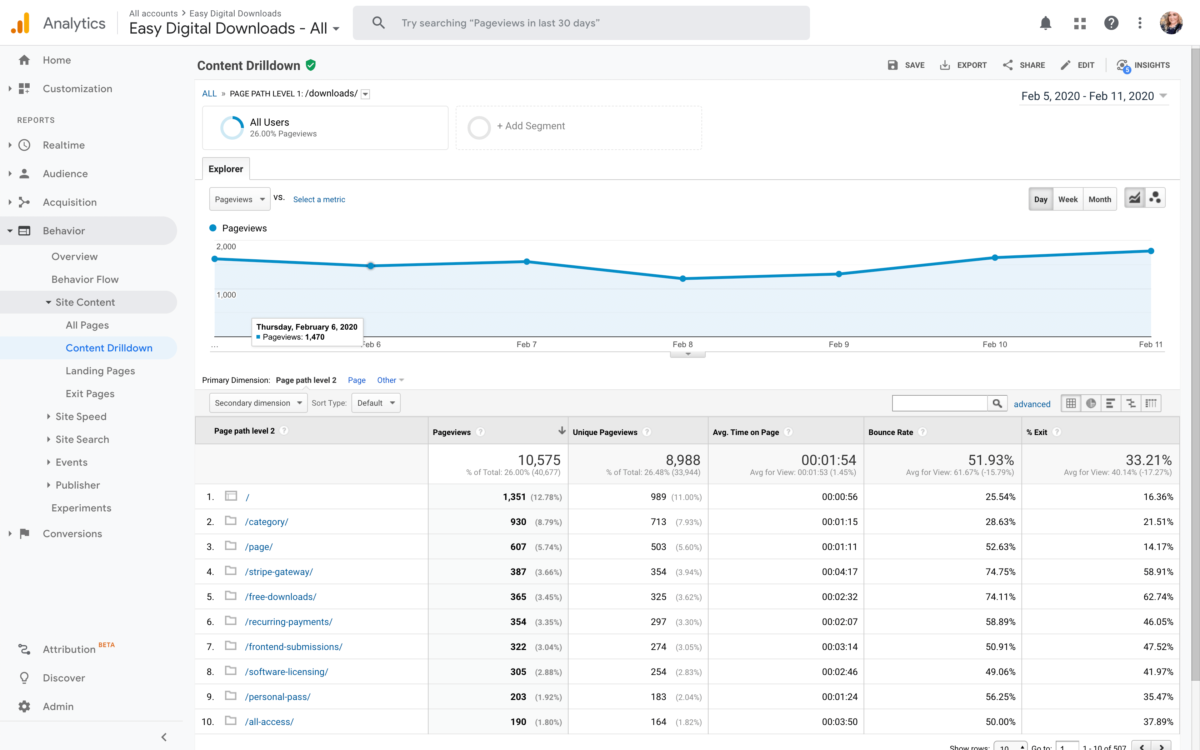
Google Analytics provides all of the essential site statistics you want to keep track of. This includes bounce rate, which can tell you a lot about how you’re presenting your products – especially if you track the bounce rate of individual product pages.
With the exception of slow load times, if you have a high bounce rate, it’s likely that your marketing is either reaching the wrong audience, or your product is being incorrectly marketed. This can be especially helpful when it comes to fine-tuning your product pages!
Plus, bounce rate comes in as the 4th most important factor contributing to search engine results page rankings, according to this report by SEMrush.
While the average bounce rate varies from industry to industry, segmenting your audience by demographic, traffic source, and interest (for example) can help you identify marketing groups that are engaging less with your pages.
Aim to improve the bounce rates for your product pages individually based on these factors, as opposed to hitting some perfect number.

Organic traffic
Just like with bounce rate, Google Analytics allows you to see where your traffic is coming from. This can be especially useful when making decisions around advertising, referral partnerships, social media, email marketing, and more.
Like other metrics mentioned, organic traffic is a measure of how well you’re marketing your products. The importance of this metric cannot be overstated, because ultimately, a good percentage of organic traffic means that you are providing what site visitors are searching for. However, that’s not to downplay the significance of other traffic sources, such as social media and referrals.
What number should you be aiming for anyway? Well, there are so many variables that there’s really no one-size-fits-all answer, but…
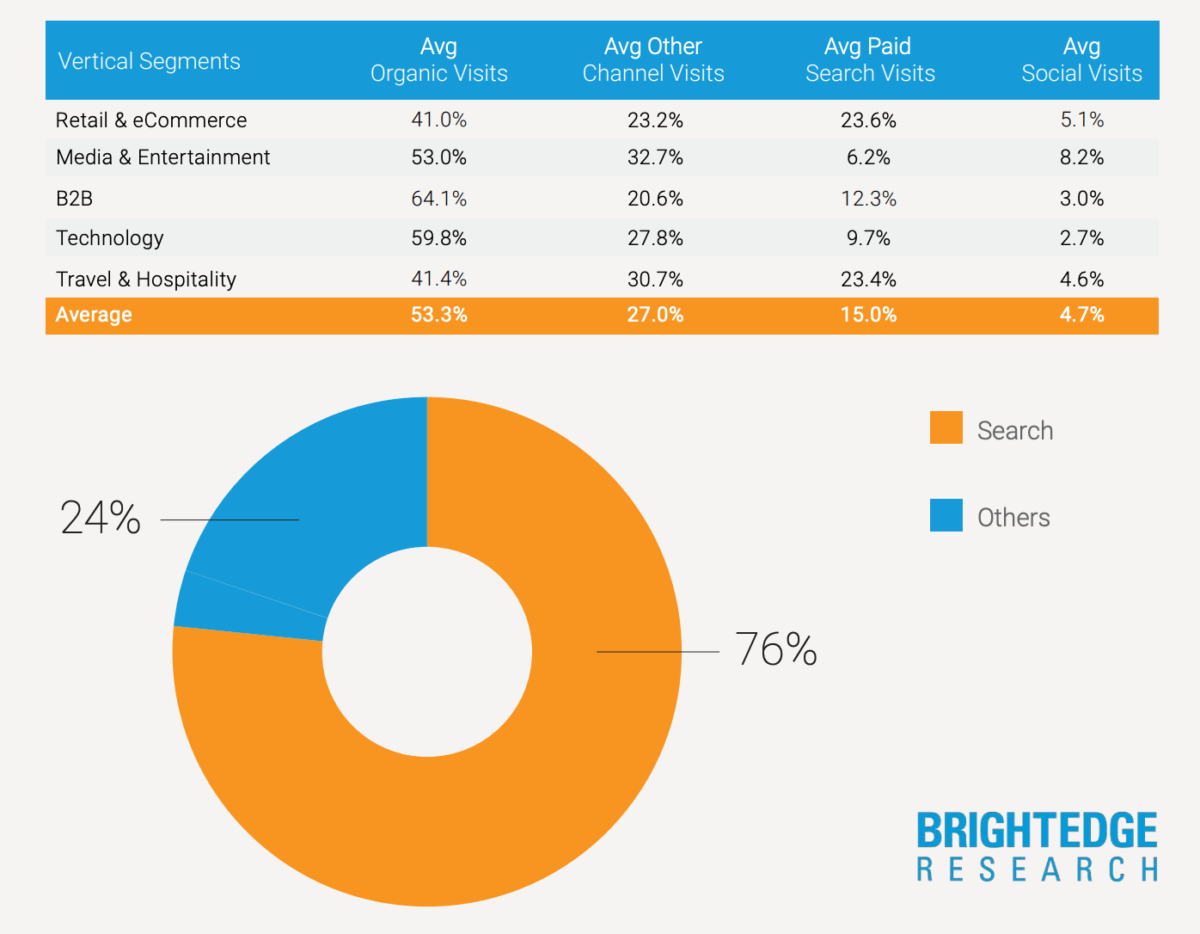
According to BrightEdge, organic visits account for an average of 41% of eCommerce traffic.

Time on page
How much time are site visitors spending on your product pages? This number is taken from all page visits that don’t bounce.
While it can be telling if your long-form content like blog posts aren’t getting more than a few seconds of time from visitors, what should you be looking for with respect to product pages?
Although there are a variety of plugins and code snippets focused on the reading time of content, you can roughly calculate it yourself by taking the average adult reading speed per minute (let’s say 250, according to this article) into account. Then, total the number of words on the page you’re looking at and divide that number by 250.
Reading time = Number of words / 250
This shows you about how many minutes the page takes to read on average. You can use this number as a benchmark for the ideal time you want visitors to spend on that page.
Product financials
Gross revenue
Do you know how much money each of your products are making and how they stack up against each other? Like conversion rate, gross revenue is an essential metric to track.
Gross revenue is the total amount of money you make on a product before subtracting expenses. Knowing this figure can be eye-opening when it comes to assessing your progress and the overall effectiveness of your efforts as a digital product seller.
Gross revenue = total revenue generated by your product (before expenses)
Profit margin
Profit margin shows you how profitable your products are after the cost of production. With digital products, the profit margin is often high due to low overhead costs, but not always. Some digital products require paying contractors, freelancers, and service providers of some kind.
First, calculate your gross profit by subtracting your costs (such as affiliate commissions and taxes) from the revenue (product price). Then, divide that number by the revenue and multiply the result by 100 to get a percentage.
Profit margin % = [ ( revenue – costs ) / revenue ] x 100
For example, if your product sells for $50 and your costs total $20, your profit margin [ ( 50-20 ) / 50 ] would be 0.6 (60%).
Refund rate
Refund rate looks at the percentage of transactions that were refunded during a specific time frame – and it’s another way to measure the performance of your products. Although they’re not very fun, refunds come with the territory of selling just about anything!
We wrote a whole post about refunds, but to summarize the statistics: We’ve experienced around a 10% refund rate at Easy Digital Downloads, while some brick-and-mortar stores can see anywhere from 10% to as high as 30%.
In general, the stats for eCommerce vary, with some sources saying 20% and others saying 30%.
Refund rate % = ( number of refunds / total transactions ) x 100
The difference with digital products is that customers don’t get to see the actual goods until they purchase them, so there can be higher refund rates for certain niches. This is also why digital product demos are so important!
Relationships between products
Products purchased together
If you want good insights on which of your products to combine into product bundles, it’s helpful to take note of which combinations of products your customers are already purchasing together. This takes some of the decision-making weight off of you and lets your customers show you what kind of bundles they’re looking for!
Repeat purchase rate
There are various reasons why you might want to keep track of the percentage of your customers who make repeat purchases. To find out, simply look at the total number of customers who made orders during a specific time period, and of those customers, note how many made another order afterwards (repeat customers).
Repeat purchase rate % = ( repeat customers / total customers ) x 100
You can use this information to segment your mailing list if you want to focus more efforts on your rockstar customers, or make future sales projections.
This is just a starting point
There are a variety of metrics you can hone in on to optimize your digital product pages, manage your priorities, and get a handle on which products need some love and which to model future products after. Hopefully they provide a starting point to help you make more informed decisions and fine-tune your product marketing for success!
Now it’s your turn! What metrics have helped you measure the performance of your own digital products? Is there something we should add to this post? Leave us a comment below.
Illustration by Jessica Johnston
Using WordPress and want to get Easy Digital Downloads for free?
Enter the URL to your WordPress website to install.
Disclosure: Our content is reader-supported. This means if you click on some of our links, then we may earn a commission. We only recommend products that we believe will add value to our readers.
Well explained! I’m doing SEO and for calculating and comparing the performance of digital products, we do use ahrefs tools. It’s a well-known tool for backlinks and SEO analysis. SEMrush, the one you mentioned is definitely good tools because it gives you tons of data and shows updated metrics.
Thanks for the feedback, Rayford!
This is an eye opening tips.
Hey, James! I’m glad it’s helpful for you.
Thanks for the tips Mandy. Once a month I go into my EDD store reports and sort it by “total sales” and “revenue”. And based on this I produce new content for my store depending on which niches/topics have been performing well. What I do to decrease bounce rate is, I offer a video course when you land on my page for joining my list. Then people that join my list stay on my site for much longer watching the videos which is helpful for them.
The video course is a great idea, Mozie! Thanks for sharing.